Transform a complex service dataset into clear, defensible, decision-relevant insights
Author
Complex Data Insights
Published
Aug 2026
COMPLEX DATA INSIGHTS
CDI Practicals
Hands-on exercises and step-by-step tools for doing, applying, and building evidence.
Statistical Inference Practical
From complex evidence to defensible insight
AuthorComplex Data Insights
PublishedAug 2026
ID: CDI-DATASCIENCE-PRACTICAL-004 Type: Guided end-to-end practical Audience: Researchers, analysts, postgraduate students, and applied data professionals Theme: Statistical reasoning, uncertainty, and evidence synthesis
How to Use This Practical
Statistical analysis can feel intimidating because selecting a test is only one part of the work. You must also understand the study design, check assumptions, quantify effects, make a hypothesis decision, and explain what the evidence does—and does not—support.
This practical gives you a repeatable reasoning pattern:
Ask a focused research question.
Identify the variables and design.
State the null and alternative hypotheses.
Select and justify the method.
check assumptions and data limitations.
Run the analysis.
report the estimate, uncertainty, statistic, and p-value.
assess effect size and practical importance.
reject or fail to reject the null hypothesis.
translate the evidence into a defensible insight.
We say fail to reject the null hypothesis, not accept the null. A non-significant result does not prove that no effect exists.
The Investigation
A service organization offers three delivery models—Standard, Digital, and Integrated—across four regions. Participants have baseline and follow-up outcome scores, wait times, satisfaction scores, and completion status. Allocation was not randomized.
The central question is:
Which service model produces the strongest outcomes, for whom, and how confidently can we defend that conclusion?
The dataset deliberately contains realistic complexity: repeated measurements, three groups, region effects, correlated outcomes, missing values, unequal sample sizes, continuous and categorical variables, and possible confounding.
Learning Outcomes
By completing the practical, you will be able to:
distinguish one-sample, independent, paired, and multi-group questions;
conduct t-tests, one-way ANOVA, Tukey HSD, correlations, and chi-square tests;
evaluate normality, variance, independence, and expected-count assumptions;
use Mann–Whitney U, Wilcoxon signed-rank, and Kruskal–Wallis sensitivity analyses;
report confidence intervals and effect sizes alongside p-values;
apply Holm correction to a family of tests;
maintain a hypothesis decision register; and
synthesize converging and conflicting evidence into a CDI Insight Brief.
What You Will Produce
a validated analysis dataset with a derived change score;
descriptive and assumption-check tables;
seven registered hypothesis tests;
an ANOVA table and Tukey post-hoc comparisons;
Pearson and Spearman correlation evidence;
chi-square observed and expected counts;
non-parametric sensitivity analyses;
multiplicity-adjusted decisions;
four analytical figures;
a hypothesis decision register; and
a CDI Insight Brief.
Tools and Requirements
Use Python 3.10 or later, VS Code with the Python and Jupyter extensions, and Quarto. From the repository root, create a dedicated environment:
Interpretation checkpoint: Missingness is part of the evidence. Record which analyses use complete cases, how many observations remain, and whether missing outcomes could bias the conclusion.
Step 4: Translate Questions into an Analysis Plan
ID
Research question
Variables and design
Primary method
H1
Is mean improvement above a meaningful 3-point benchmark?
One change score versus a fixed value
One-sample t-test
H2
Does improvement differ between Integrated and Standard?
Two independent groups
Welch t-test
H3
Did participants improve from baseline to follow-up?
Two measurements on the same people
Paired t-test
H4
Does improvement differ across all three models?
Continuous outcome, three groups
One-way ANOVA + Tukey HSD
H5
Is wait time linearly related to satisfaction?
Two continuous variables
Pearson correlation
H6
Is age monotonically related to satisfaction?
Two ordinal/continuous variables
Spearman correlation
H7
Is completion associated with service model?
Two categorical variables
Chi-square independence test
For every row, the null hypothesis states no difference or association in the target population. The alternative states that a difference or association exists. H1 is directional because the benchmark question was prespecified as greater than.
Use robust/non-parametric sensitivity analysis; investigate design problems
Standard ANOVA
Similar group variances
Group spreads; Brown–Forsythe test
Consider Welch ANOVA; report sensitivity
Pearson correlation
Linear relationship without dominant outliers
Scatterplot and residual pattern
Add Spearman; consider transformation or nonlinear method
Chi-square
Independent observations and adequate expected counts
Expected-frequency table
Combine defensible categories or use an exact method
Show code
normality = []for model, group in df.groupby("service_model"): statistic, p_value = stats.shapiro(group["change_score"].dropna()) normality.append({"model": model, "W": statistic, "p_value": p_value})variance_test = stats.levene(*(g["change_score"].dropna() for _, g in df.groupby("service_model")), center="median")pd.DataFrame(normality), variance_test
(        model         W   p_value
 0     Digital  0.985756  0.266146
 1  Integrated  0.986852  0.293581
 2    Standard  0.992519  0.783278,
 LeveneResult(statistic=np.float64(3.586438876984337), pvalue=np.float64(0.02871937600749347)))
Show code
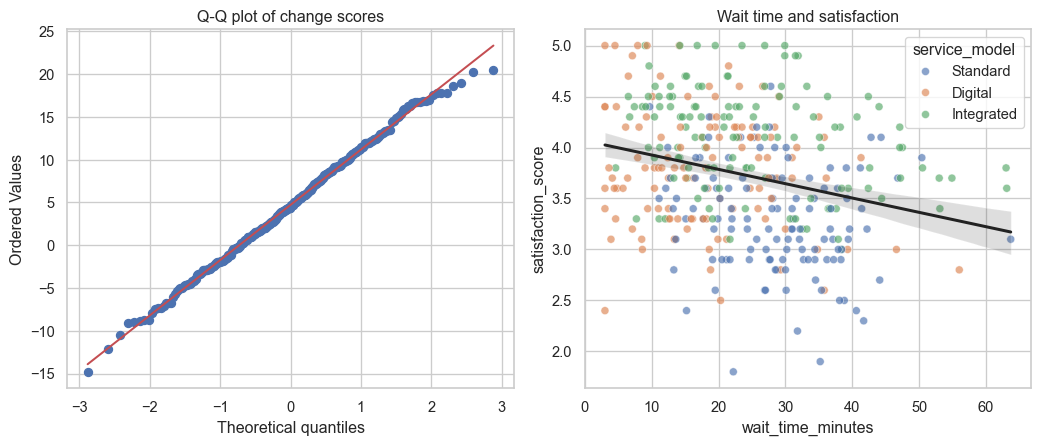
fig, axes = plt.subplots(1, 2, figsize=(11, 4.8))stats.probplot(df["change_score"].dropna(), plot=axes[0])axes[0].set_title("Q-Q plot of change scores")sns.scatterplot(data=df, x="wait_time_minutes", y="satisfaction_score", hue="service_model", alpha=.65, ax=axes[1])sns.regplot(data=df, x="wait_time_minutes", y="satisfaction_score", scatter=False, color="#222", ax=axes[1])axes[1].set_title("Wait time and satisfaction")plt.tight_layout()plt.show()
Figure 2: A Q-Q diagnostic for change scores and the observed wait-time–satisfaction relationship.
Do not reject a method automatically because a large-sample normality test is significant. Combine design knowledge, graphical evidence, sample size, robustness, and sensitivity analyses.
Step 7: Test a Meaningful Benchmark — One-Sample t-Test
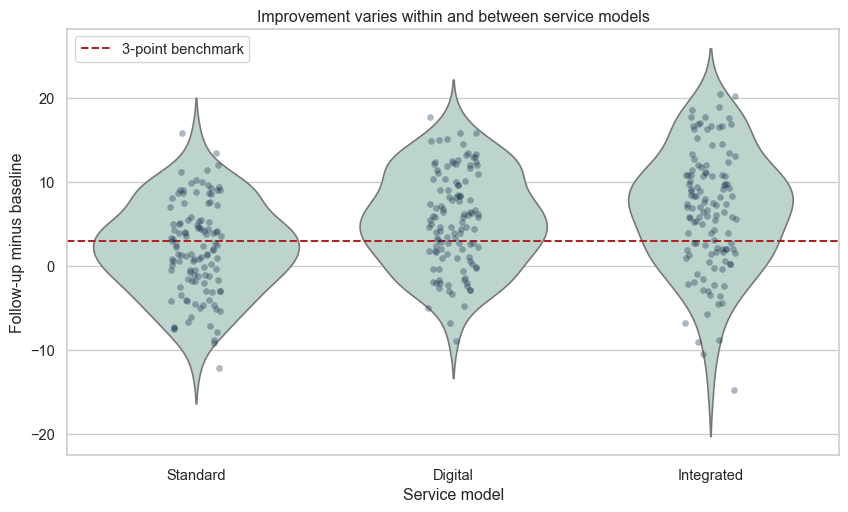
Decision rule: reject H0 when the prespecified one-sided p-value is below 0.05. Then interpret how far the mean lies above the benchmark and whether that excess is practically meaningful.
Welch’s test is the default here because it does not require equal group variances. A statistically detectable difference is not automatically large, useful, or causal.
The pairing is essential: baseline and follow-up values belong to the same person. An independent t-test would discard that structure and answer the wrong question.
Step 10: Compare Three Groups — ANOVA
Show code
groups = [g["change_score"].dropna() for _, g in df.groupby("service_model")]h4 = stats.f_oneway(*groups)grand_mean = df["change_score"].mean()ss_between =sum(len(g) * (g.mean() - grand_mean)**2for g in groups)ss_total = ((df["change_score"] - grand_mean)**2).sum()eta_squared = ss_between / ss_totalh4, eta_squared
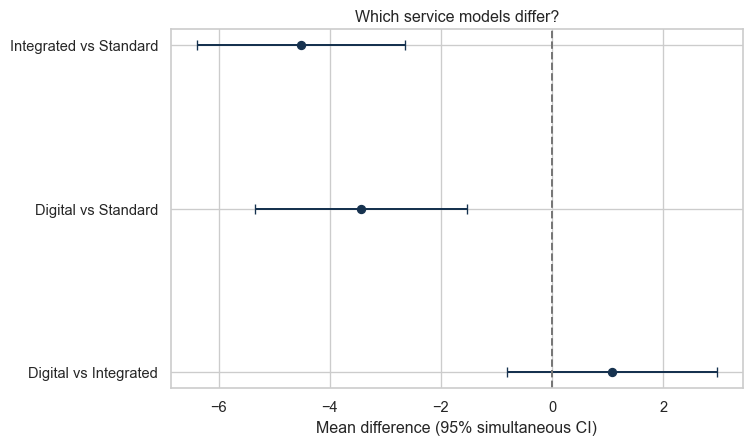
ANOVA answers whether at least one population mean differs. It does not identify which pairs differ, so a significant omnibus result must be followed by planned or multiplicity-controlled comparisons.
Pearson tests the linear wait-time relationship. Spearman tests a separate monotonic age-satisfaction question and illustrates a defensible fail to reject H0 decision. That decision is insufficient evidence of a relationship, not proof of no relationship. Neither correlation establishes causality.
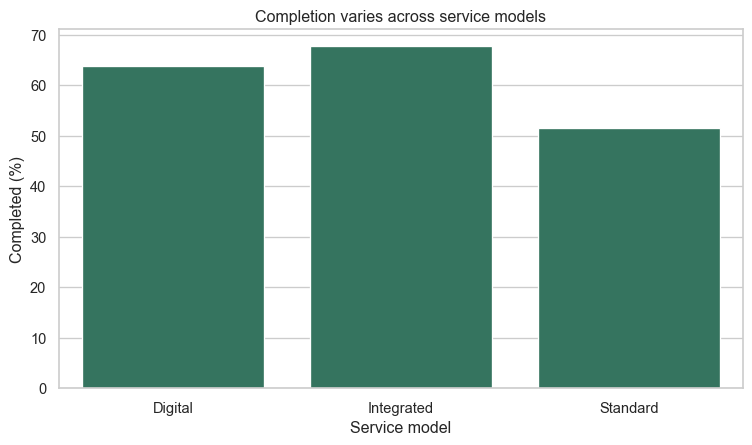
Step 13: Test Categorical Association — Chi-Square
Non-parametric tests answer related but not identical questions. Use them as sensitivity evidence, not as automatic replacements selected only because a normality p-value crossed 0.05.
Multiplicity correction protects against accumulating false-positive risk. It does not rescue an unfocused analysis plan; prespecify primary and supporting questions whenever possible.
Step 16: Build the Hypothesis Decision Register
For each hypothesis, record:
the research question and estimand;
H0 and H1;
method and justification;
relevant assumptions;
sample size, estimate, and 95% confidence interval;
effect size;
raw and adjusted p-values;
Reject H0 or Fail to reject H0;
plain-language interpretation;
practical importance; and
limitations and unsupported claims.
The reference workflow exports results/tables/hypothesis-decision-register.csv. Treat this as the bridge from test output to accountable insight.
Step 17: Transform the Evidence into a CDI Insight Brief
Central question: Which service model produces the strongest outcomes, for whom, and how confidently can we defend that conclusion?
Key findings: State the most decision-relevant results, not every p-value.
Practical importance: Explain whether detected differences are large enough to matter.
Consistent or conflicting evidence: Identify where methods agree and where they do not.
Uncertainty and limitations: Address missingness, observational allocation, region composition, multiplicity, and measurement limitations.
Recommended action: Propose a proportionate next step supported by the evidence.
Claims not supported: Explicitly state what the analysis cannot establish.
A defensible conclusion might prioritize investigation of Integrated service features while improving Standard delivery, yet still recommend prospective confirmation before claiming the service model caused better outcomes.
Step 18: Complete an Independent Challenge
Choose one extension:
test whether outcomes differ by region and consider whether region may confound service comparisons;
examine whether the service-model effect differs across age groups;
evaluate whether missing follow-up scores could change the conclusion; or
define a new primary outcome and build a fresh decision-register entry.
Your extension must use the same CDI reasoning pattern and end with a bounded, evidence-supported insight.
Common Mistakes to Avoid
choosing a test before defining the question and design;
treating p < 0.05 as proof of importance or causality;
saying “accept H0” after a non-significant result;
running independent tests on paired observations;
interpreting ANOVA as proof that every group differs;
reporting only p-values without estimates, intervals, and effects;
using assumption tests mechanically without inspecting plots and design;
conducting many unplanned tests without multiplicity control;
converting association into causal language; and
hiding uncertainty or evidence that conflicts with the preferred narrative.
Completion Checklist
Final Reflection
The statistical test is not the product. The product is a clear, defensible insight that respects study design, uncertainty, practical importance, alternative explanations, and the limits of the evidence.